
Most options backtests start from end-of-day data: one bid and one ask per contract, per day. The simplest fill rule is to trade at the midpoint, halfway between the two. It feels neutral. It is not.
A closing quote is a snapshot. It may not line up in time with the underlying price it gets paired with. The market maker who posted it has no duty to honor it tomorrow. And the midpoint is a price you only get if you can time your orders well, which a daily bar cannot show. This post walks through each of these gaps, what the research measured, and how to put a number on the difference for your own strategy.
Three things a closing quote is not
It is not synchronized with the underlying. Battalio and Schultz (2006) pointed out that the widely used OptionMetrics database paired closing option quotes stamped 4:02 p.m. with stock closing prices from 4:00 p.m. or earlier. In their sample of internet-bubble options from February 2000, more than 31% of internet-stock options changed their bid, ask or both in those two minutes. When quotes did change, the average absolute two-minute move in the midpoint was 144 basis points (1.44%).
The issue did not go away. Wallmeier (2024) found that OptionMetrics now records US option prices at 3:59 p.m., while the underlying close is taken at 4:00 p.m. That one-minute gap alone creates artificial swings in implied volatility spreads, with large distortions at the start of the COVID-19 crash. Index options add another wrinkle: SPX options trade until 4:15 p.m. ET, while the stocks in the index close at 4:00 p.m. (Cboe).
It is not a firm price. During the day, market makers are obliged to trade at their posted quotes. Closing quotes posted on day t carry no obligation to trade on day t+1 (Battalio and Schultz, 2006). The quote you backtest against may never have been available to anyone.
It is not a typical moment. Research on when spreads are widest disagrees across eras and products. Chan, Chung and Johnson (1995) found CBOE option spreads fall sharply after the open and then level off. A 2024 study of SPX options presented at the AEA meetings found percentage spreads high at the open and again shortly before the close. Either way, a single daily snapshot tells you nothing about how wide the market was when you would actually have traded.
In plain terms: an end-of-day quote is a photograph of a price, taken at an arbitrary moment, that nobody promised to honor.
How bad can it get? The put-call parity test
Battalio and Schultz ran a clean experiment. Put-call parity says a call, a put and cash can be combined into a "synthetic" share of stock. If the synthetic share is cheaper or dearer than the real one, there is an apparent arbitrage.
Using the OptionMetrics closing data for February 2000, they found apparent arbitrage in 30.6% of internet-stock option pairs. Then they applied screens: they removed cases where the stock quote at 4:00 p.m. was locked or crossed (bid equal to or above the ask), option quotes that were locked, crossed or too wide to be firm, and stale closing prices. For options with 31 to 60 days to expiry, the violation rate for internet stocks fell from 25.5% to 4.1%.
With their own time-stamped intraday quotes, 22% of synthetic prices first looked like arbitrage. After dropping quotes nobody could trade on, about 1.4% remained, and only 0.43% promised a profit of 10 cents per share or more. The "opportunities" were almost entirely a product of the data.
A backtest that fills at closing quotes inherits exactly this problem. It cannot tell a real edge from a stale print.
Mid fills assume execution skill you can't verify
Now suppose the closing quote is accurate. Is the midpoint a fair fill?
Sometimes it is close. Muravyev and Pearson (2020) studied US equity options from April 2003 to October 2006 with trade-level data. Traders who timed their orders, buying when the option's fair value sat near the ask and selling when it sat near the bid, paid effective spreads under 40% of conventional estimates. The effective spread is twice the distance between your fill and the quote midpoint, so it measures what you really paid to trade.
That finding cuts both ways for backtesting. The low costs came from timing, which requires watching prices change within the day. A daily bar records none of that. Filling every trade at mid quietly assumes you had that timing skill on every single trade.
Do, Foster and Gray (2016) reached the same point from the other side. They retested a well-known strategy, the volatility-spread trade of Goyal and Saretto (2009), on Australian equity options using tick-level bid-ask quotes. Transaction costs erased much of the profit. They concluded the strategy's profitability depends on achieving effective spreads well inside the quoted spread and timing trades intelligently.
The math: one parameter controls the result
Practitioners model this with a single "slippage" fraction, s, the share of the bid-ask width you give up on each trade. ORATS documents this method for its backtester:
Buy price = Bid + s · (Ask − Bid) Sell price = Ask − s · (Ask − Bid)
where:
- Bid and Ask are the quotes at the moment of the simulated trade
- s is the slippage fraction: 0.5 means a midpoint fill, 1.0 means buying at the ask and selling at the bid
The cost you pay versus a midpoint fill, per trade, is:
Cost vs. mid = (s − 0.5) · W
where W is the bid-ask width of the position you're trading.
At s = 0.5 the cost is zero. That is the midpoint assumption, and it is the only setting where trading is free.
Cost scales with width, not price. A $0.20-wide market costs the same in dollars to cross whether the option is worth $1 or $10. On cheap, far out-of-the-money options, that can be a large share of the premium.
ORATS uses these defaults: 75% of the width for one leg, 66% for two legs, 56% for three and 53% for four. Fewer percent per leg does not mean cheaper: a four-leg position has four widths to cross, so its combined width is usually much larger. These are one vendor's assumptions based on its own trading experience, not a measured market average.
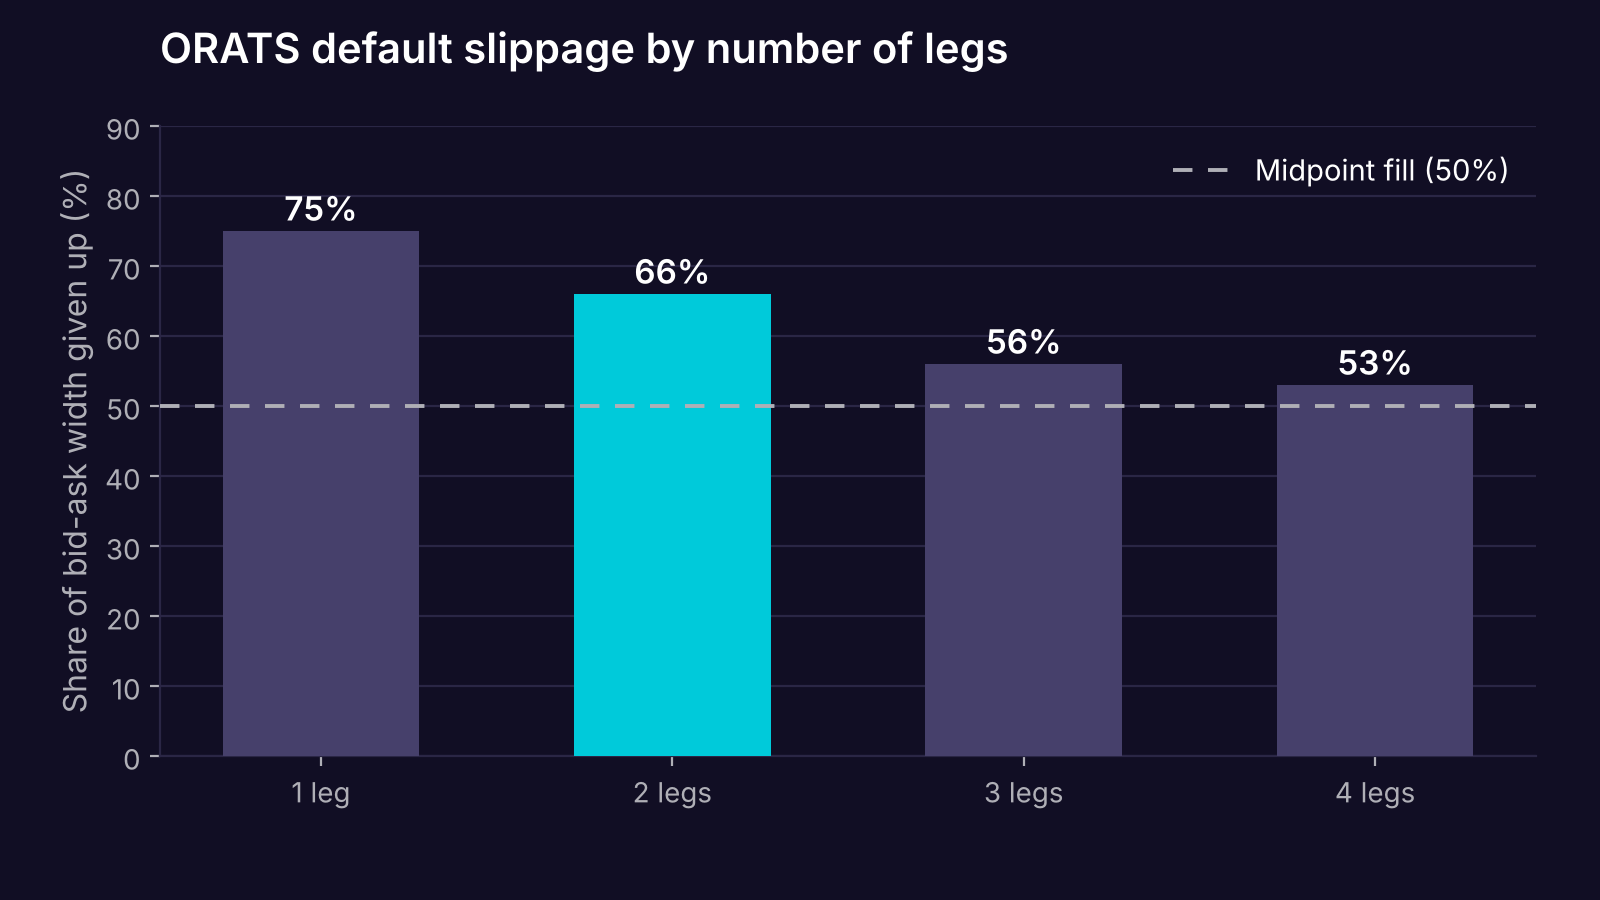
ORATS default slippage as a share of the combined bid-ask width. Every setting sits above the 50% midpoint line. Data: ORATS backtester documentation.
The evidence: same strategies, two fill rules
Santa-Clara and Saretto (2009) gave a direct comparison. They used OptionMetrics closing bid and ask quotes on S&P 500 index options from January 1996 to April 2006. Each strategy wrote options with about 45 days to expiry and was rebalanced monthly. They computed returns twice: once trading at midpoints, once selling at the bid and buying at the ask.
| Strategy (writing options) | Sharpe at mid | Sharpe bid-to-ask | Change |
|---|---|---|---|
| Put, 10% out of the money | 1.054 | 0.801 | −24% |
| Straddle, at the money | 0.666 | 0.460 | −31% |
| Strangle, 5% out of the money | 0.673 | 0.497 | −26% |
| Strangle, 10% out of the money | 0.972 | 0.666 | −32% |
Sharpe ratios of monthly returns. Data: Santa-Clara and Saretto (2009), Table 4.
Average returns for writing puts fell by 5% to 9% per month once spreads were paid. For the at-the-money straddle, the bid-ask spread cost 5.3% per month. Sharpe ratios fell by an even larger proportion, because costs also changed the strategies' volatility.
Two honest caveats from the same paper. First, costs did not completely wipe out these strategies' profits in this sample. Second, if positions are held to expiry, only half the round-trip cost applies. The bigger hit in their study came from margin: forced liquidations during losses drove the at-the-money straddle's Sharpe ratio from 0.14 to 0.07 as position size grew from 2.5% to 20% of capital.
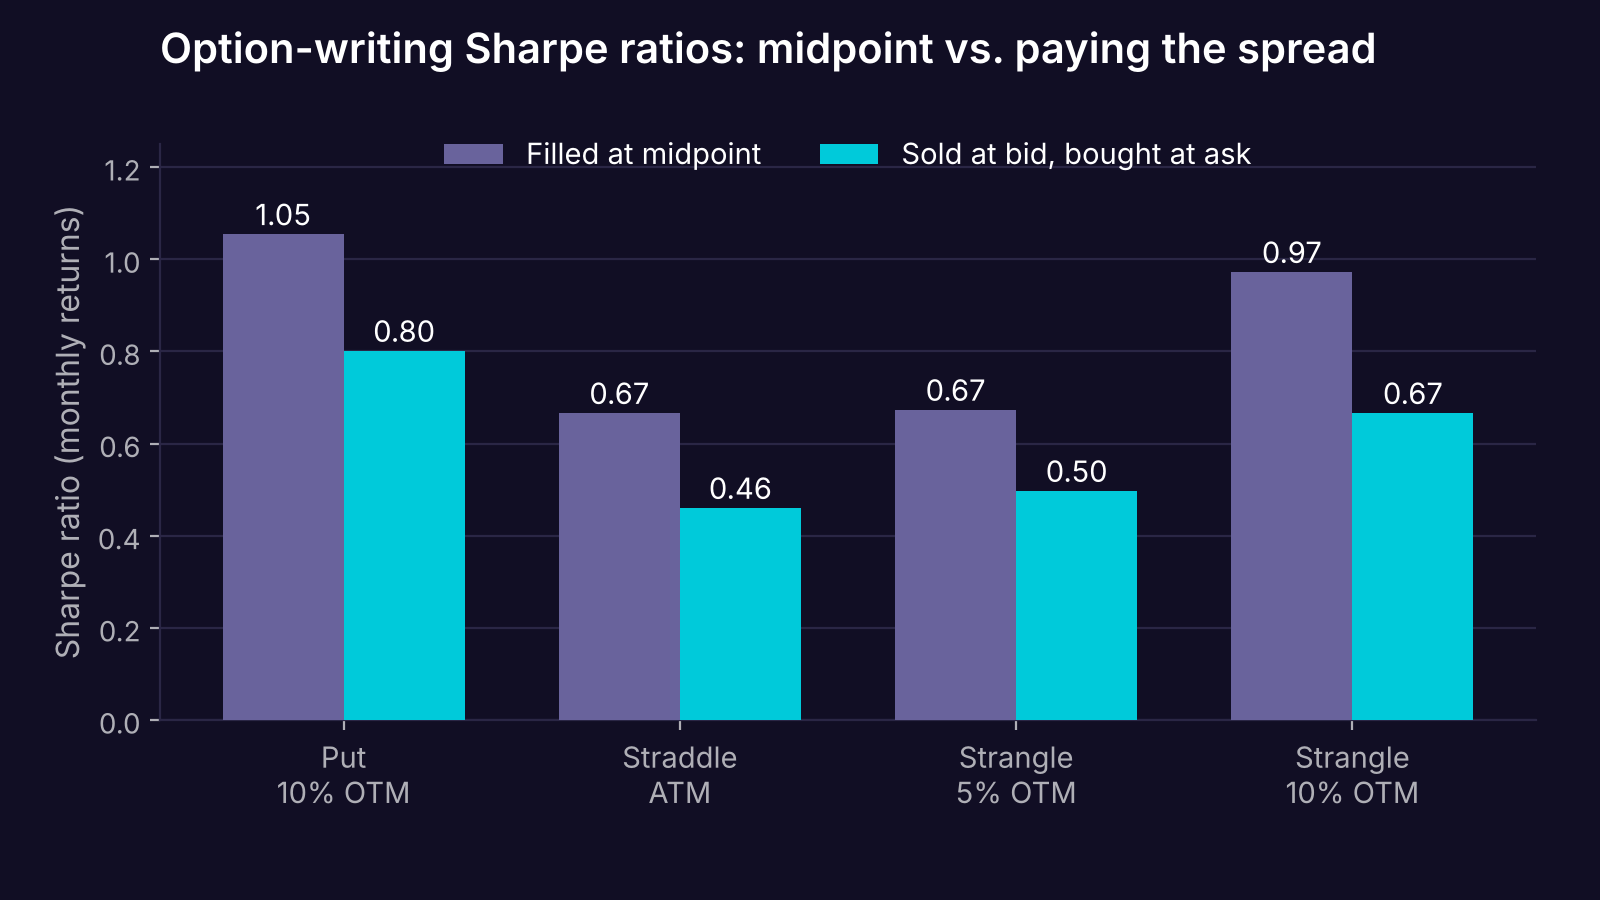
Same data, same strategies, different fill rule. Data: Santa-Clara and Saretto (2009), Table 4, S&P 500 index options 1996–2006.
A broader recent study points the same way. O'Donovan and Yu (working paper, revised 2025) tested 24 long-short portfolios of delta-hedged equity options. Seventeen showed positive and significant returns before costs. None stayed profitable after costs, though a cost-mitigation approach restored profits for seven.
A worked example you can check on paper
Take a hypothetical put credit spread on a stock trading near $510. The quotes below are illustrative, not market data.
- Sell the 500 put: bid $3.10, ask $3.20
- Buy the 495 put: bid $2.05, ask $2.13
The spread's own market is the combination of the legs:
- Spread bid (what you'd receive selling at worst) = 3.10 − 2.13 = $0.97
- Spread ask = 3.20 − 2.05 = $1.15
- Width W = $0.18, midpoint = $1.06
Later, you close it. The spread is quoted $0.34 bid, $0.46 ask, so W = $0.12 and the midpoint is $0.40.
| Fill rule | Entry credit | Exit debit | Profit per spread |
|---|---|---|---|
| Midpoint (s = 0.5) | $1.06 | $0.40 | $0.66 |
| ORATS 2-leg (s = 0.66) | $1.03 | $0.42 | $0.61 |
| Natural (s = 1.0) | $0.97 | $0.46 | $0.51 |
Profits are rounded to the cent. Moving from mid to s = 0.66 cuts this trade's profit by about 8%. Paying the full spread cuts it by about 23%. The losing trades get worse by the same dollar amounts, so the backtest's total edge shrinks on both sides.
Run this over hundreds of trades and the difference compounds. That is why two backtests on identical data can tell opposite stories. ORATS showed this with VXX call spreads: a long and a short call spread with the same rules returned −9.23% and +3.51% a year, not equal and opposite. Slippage and commissions took about 2.86% a year from each side.
What it means in practice
Report results at more than one fill rule. Run the same backtest at s = 0.5, a middle value such as 0.66, and s = 1.0. If the strategy only works at mid, the edge depends on execution you haven't shown you can achieve.
Check the edge per trade against the width. If your average profit per trade is smaller than the combined bid-ask width you cross, small changes in s will flip the result.
Count the legs and the trades. Every leg and every adjustment crosses another spread. Strategies that trade often or roll frequently pay more, and margin-driven forced exits add trades at the worst moments (Santa-Clara and Saretto, 2009).
Align timestamps. Make sure the option quote and the underlying price come from the same moment. A snapshot taken before the close with a synchronized underlying price avoids the mismatch documented by Battalio and Schultz (2006) and Wallmeier (2024). ORATS, for example, takes its daily snapshots 14 minutes before the close.
Discard quotes you couldn't trade. Locked, crossed or unusually wide quotes produced most of the false arbitrage in Battalio and Schultz's data. A filter for them is cheap and removes fills that never existed.
What this doesn't tell you
The slippage fraction is an assumption, not a measurement. Muravyev and Pearson show skilled traders can do much better than the quoted spread, and multi-leg orders can sometimes fill inside the combined quote on an exchange's complex order book. Exchange rules define the best net bid and offer for a multi-leg strategy from the individual legs' best quotes (BOX, SEC filing 2017), but no one is obliged to fill your spread at that price.
The studies above cover specific markets and periods: S&P 500 index options from 1996 to 2006, US equity options from 2003 to 2006, Australian equity options, and a February–June 2000 sample for the timing tests. Spreads and market structure have changed since. None of these results says your strategy will or won't survive costs. They show that the fill assumption can move a backtest's result as much as the strategy rules do.
Finally, costs are only one way a backtest can mislead. Testing many variations and keeping the best one inflates results too, a problem Bailey, Borwein, López de Prado and Zhu (2017) formalized as the probability of backtest overfitting.
Where Quantropy fits
Quantropy runs backtests on tick-level historical options data, so fills can be simulated against the quotes that existed at the moment of each trade rather than a single daily snapshot. That makes it practical to rerun the same strategy across fill assumptions and see how much of the result comes from the edge and how much from the midpoint. Join early access.
This post is for educational purposes only and does not constitute financial or investment advice. Options trading involves substantial risk of loss and is not suitable for all investors. Backtested results are hypothetical, have inherent limitations, and do not guarantee future performance.
Sources
- Battalio, R., & Schultz, P. (2006). "Options and the Bubble." Journal of Finance, 61(5), 2071–2102. https://www3.nd.edu/~pschultz/options_and_bubble.pdf
- Wallmeier, M. (2024). "Quality issues of implied volatilities of index and stock options in the OptionMetrics IvyDB database." Journal of Futures Markets, 1–22. https://doi.org/10.1002/fut.22495
- Muravyev, D., & Pearson, N. D. (2020). "Options Trading Costs Are Lower than You Think." Review of Financial Studies, 33(11), 4973–5014. https://doi.org/10.1093/rfs/hhaa010
- Santa-Clara, P., & Saretto, A. (2009). "Option strategies: Good deals and margin calls." Journal of Financial Markets, 12(3), 391–417. https://personal.utdallas.edu/~axs125732/OptionsJFM2009.pdf
- Do, B. H., Foster, A., & Gray, P. (2016). "The Profitability of Volatility Spread Trading on ASX Equity Options." Journal of Futures Markets, 36(2), 107–126. https://ideas.repec.org/a/wly/jfutmk/v36y2016i2p107-126.html
- Goyal, A., & Saretto, A. (2009). "Cross-section of option returns and volatility." Journal of Financial Economics, 94(2), 310–326. https://ideas.repec.org/a/eee/jfinec/v94y2009i2p310-326.html
- O'Donovan, J., & Yu, G. Y. (2025). "A Transaction Cost Perspective on Option Anomalies." Working paper, Singapore Management University. https://papers.ssrn.com/abstract=4806038
- Chan, K., Chung, Y. P., & Johnson, H. (1995). "The Intraday Behavior of Bid-Ask Spreads for NYSE Stocks and CBOE Options." Journal of Financial and Quantitative Analysis, September 1995. https://scholars.cityu.edu.hk/en/publications/the-intraday-behavior-of-bid-ask-spreads-for-nyse-stocks-and-cboe/
- "Evidence from SPX Options" (intraday spreads and order flow). Paper presented at the 2024 AEA Annual Meeting. https://topcat.aeaweb.org/conference/2024/program/paper/DFs2GZND
- Bailey, D. H., Borwein, J. M., López de Prado, M., & Zhu, Q. J. (2017). "The probability of backtest overfitting." Journal of Computational Finance, 20(4). https://papers.ssrn.com/abstract=2326253
- ORATS. "Answers to Common Questions: Backtesting." ORATS blog. https://orats.com/blog/answers-to-common-questions-backtesting
- ORATS. "Help, My Backtest Isn't Working." ORATS blog. https://orats.com/blog/help-my-backtest-isnt-working
- ORATS. "The Tale of Two Backtests: Why Aren't Opposite Strategies' Absolute Returns Equal?" ORATS blog. https://orats.com/blog/the-tale-of-two-backtests-why-arent-opposite-strategies-absolute-returns-equal
- OptionMetrics. "IvyDB US." https://optionmetrics.com/united-states/
- Cboe. "S&P 500 Index Options Product Specifications." https://www.cboe.com/tradable_products/sp_500/spx_options/specifications/
- BOX Options Exchange. Rule filing on complex orders, Release No. 34-80917 (2017). U.S. Securities and Exchange Commission. https://www.sec.gov/rules/sro/box/2017/34-80917.pdf