
A straddle pairs a call and a put on one underlying, struck at the same price and expiring on the same date. If you buy the pair, you are long the straddle. If you sell it, you are short.
Most explanations stop at "long straddles like big moves, short straddles like calm markets." That holds at expiration, but it skips the variable that actually decides the result. The price you pay or collect is the market's own forecast of how far the stock will travel. So the useful question is not "will it move?" but "will it move more than the market already expects?"
Below we cover both sides: how they are built, what their risk profiles look like, a one-line formula that turns a straddle price into an expected move, and what the academic evidence says about which side has been paid over time.
How a straddle is built
Traders usually pick the at-the-money strike, the one nearest the current stock price. There, the call's delta sits close to +0.50 and the put's close to −0.50. They cancel, so the combined position starts with almost no directional exposure.
Long straddle. You pay for both options up front. At expiration, at most one leg has value, and together they are worth exactly |stock price − strike|. The trade makes money when that gap is wider than the total premium.
Short straddle. You receive the same premium as a credit. You keep every dollar only if the stock lands exactly on the strike. Each dollar of distance from the strike eats into the credit, and beyond the breakevens the losses are yours.
Both sides share the same two breakeven prices at expiration:
Upper breakeven = strike + total premium Lower breakeven = strike − total premium
In plain terms: the premium sets the width of a zone around the strike. Finish inside it and the seller wins. Finish outside it and the buyer wins.
The risk profiles
To make this concrete, take a hypothetical stock at $460. The 460 call costs $17.10 and the 460 put costs $15.70, both expiring in 60 days. The straddle costs $32.80 per share, or $3,280 per 100-share contract. The breakevens are $427.20 and $492.80.
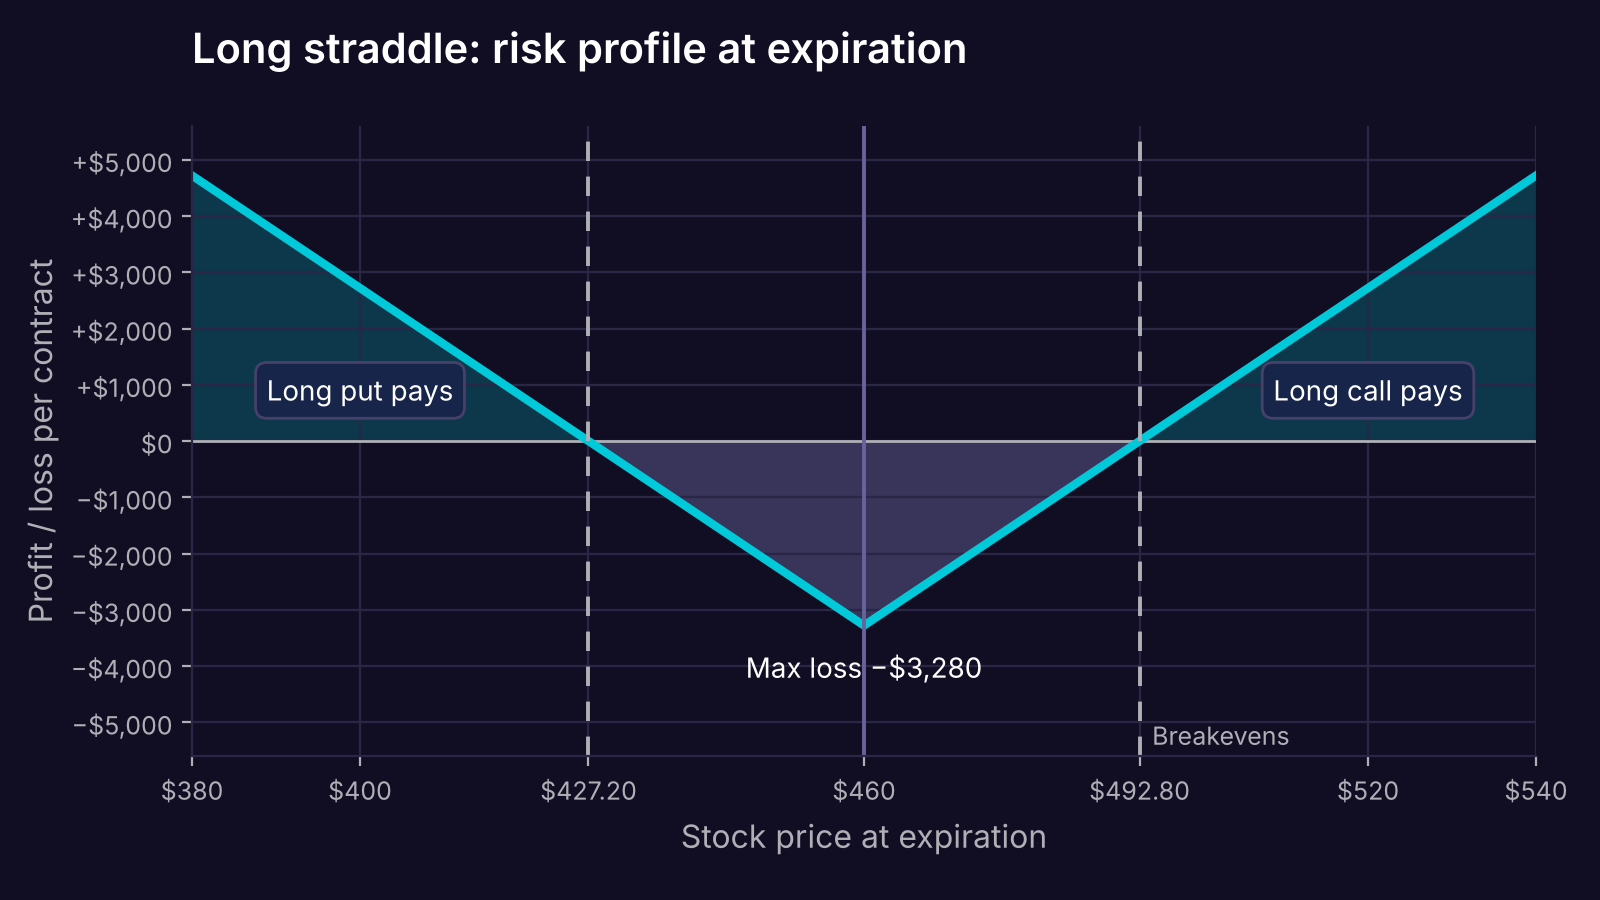
Long straddle at expiration. The worst case is losing the full $3,280 premium, which happens only if the stock closes right at $460. Gains begin below $427.20 or above $492.80. Hypothetical example.
The long straddle draws a V. Its lowest point is the premium paid, which is also the maximum loss. Past either breakeven, each $1 move in the stock adds $100 per contract.
One detail is often glossed over. The gain is open-ended only on the upside. Because a stock can't fall below zero, the put side can pay at most the strike minus the premium: $427.20 per share here, or $42,720 per contract. Large, but finite.
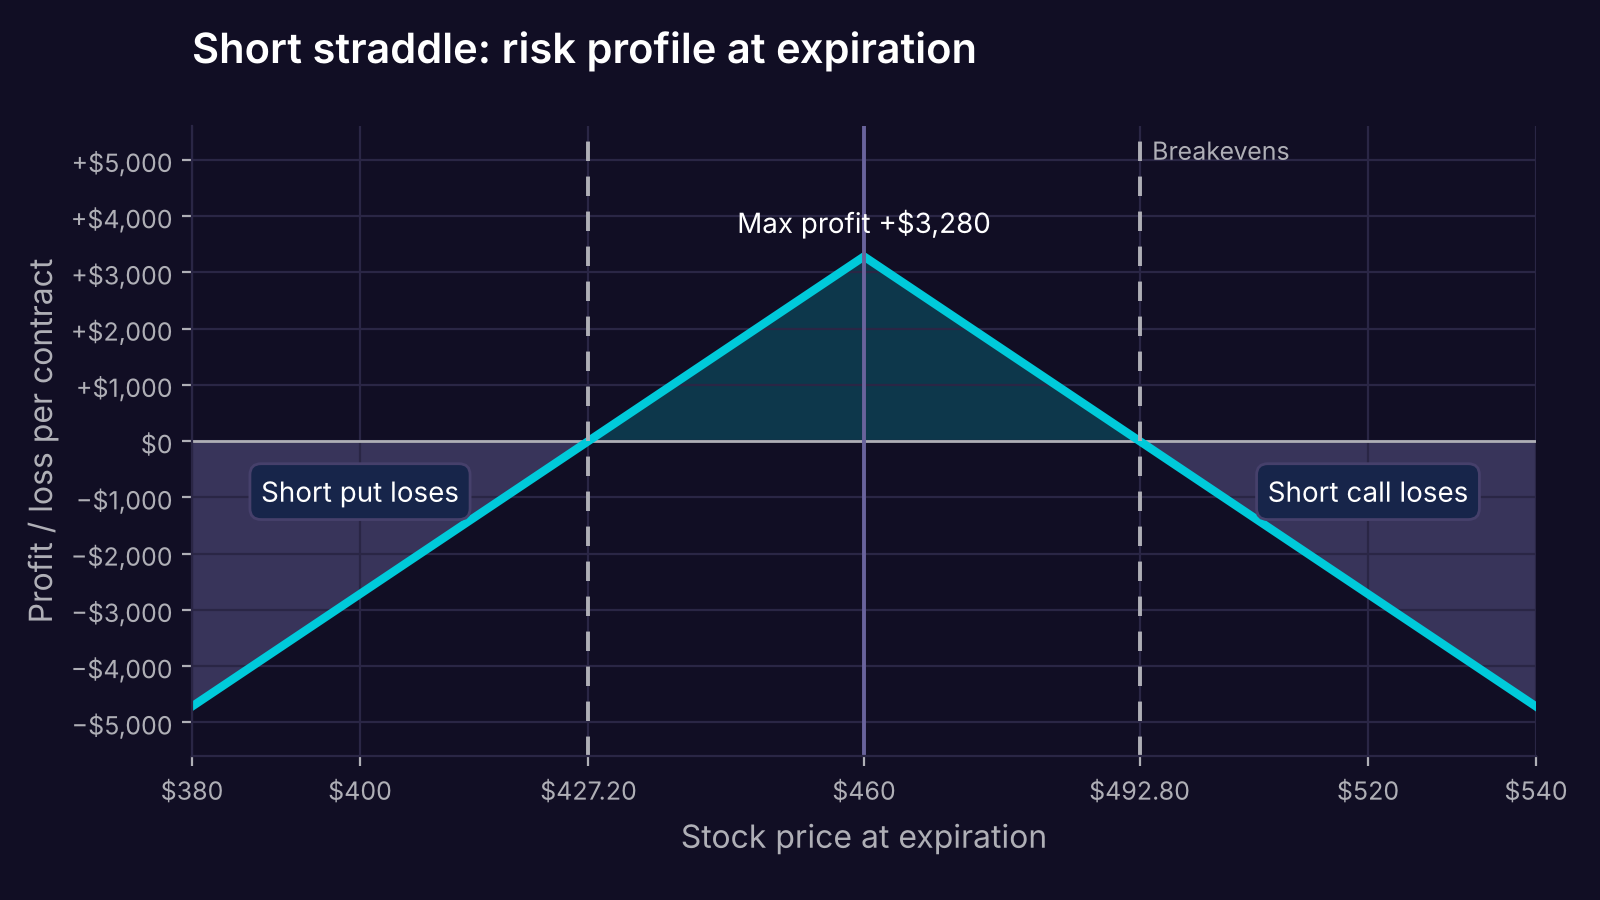
Short straddle at expiration, the mirror image. Profit is capped at the $3,280 credit; losses keep growing the further the stock travels. Hypothetical example.
The short straddle flips the picture. Its best outcome is the whole $3,280 credit, and only at one price. Its worst outcome has no ceiling on the upside, and reaches $42,720 per contract on the downside if the stock goes to zero.
The Greeks, side by side
| Long straddle | Short straddle | |
|---|---|---|
| Delta at entry | Near zero | Near zero |
| Gamma | Positive: delta follows the move | Negative: delta fights the move |
| Theta | Negative: bleeds value daily | Positive: collects value daily |
| Vega | Positive: gains when IV rises | Negative: gains when IV falls |
| Max loss | Premium paid × 100 | No cap on the upside |
| Assignment risk | None, nothing is sold | Yes, on any in-the-money leg |
Gamma, the rate at which delta changes as the stock moves, is why the two positions behave so differently. As the stock climbs, the long straddle picks up positive delta; as it falls, it picks up negative delta. It automatically leans with the trend. The short straddle leans against it, getting shorter into a rally and longer into a selloff.
Vega, the change in an option's price for a one-point move in implied volatility, is the Greek that dominates. Vega peaks near the money, so an at-the-money straddle packs about as much volatility exposure as one expiration can hold.
At expiration, an in-the-money long option converts into stock. A long straddle that finishes above the strike leaves you with +100 shares per contract; one that finishes below leaves −100 shares. Closing before expiration avoids that conversion.
Reading a straddle price as an expected move
Strategy guides rarely include the most useful fact about straddles: a quick formula translates the at-the-money price into the move the market is forecasting.
Brenner and Subrahmanyam (1988) showed that an at-the-money option is worth about 0.4 · S · σ · √T. Double it for the call-plus-put pair:
Straddle ≈ 0.8 · S · σ · √T
where:
- S is the stock price.
- σ is implied volatility, as an annual decimal (22% = 0.22).
- T is time to expiration in years (60 days = 60/365).
- 0.8 is approximately √(2/π) ≈ 0.798.
That constant has a meaning. If returns are normal with standard deviation σ√T, the average size of the move, ignoring its sign, is exactly √(2/π) · σ√T. So the straddle price is roughly the average dollar move the market expects by expiration.
The breakeven is the market's expected move. Buying the straddle bets that the realized move beats that expectation. Selling it bets that it falls short.
Average profit is the gap between realized and implied volatility. Held to expiration, a long straddle earns on average about 0.8 · S · √T · (σ realized − σ implied). If the stock ends up exactly as volatile as the market priced, the trade breaks even on average, before costs.
In plain terms: a straddle doesn't reward you for predicting that a stock will move. It rewards you for predicting how much more, or less, it moves than everyone else assumed.
A worked example
Use the hypothetical trade: S = $460, T = 60/365 ≈ 0.164, straddle = $32.80.
- Implied move. $32.80 ÷ $460 = 7.13%. The market expects the stock to travel about 7.1% by expiration, up or down.
- Implied volatility. Rearranging the formula: 32.80 ÷ (0.8 × 460 × √0.164) ≈ 22.0% annualized.
- Chance the long side finishes in profit, using the market's own volatility. The breakeven sits 0.80 standard deviations away (7.13% ÷ (22.0% × √0.164)). The odds of a move beyond that, in either direction, are about 42%, leaving the short side about 58%.
- What realized volatility changes. If the stock actually moves with 30% volatility, the average move is about 0.8 × 460 × 0.30 × √0.164 ≈ $44.76. The long straddle's average result is then about +$11.96 per share, or +$1,196 per contract. If realized volatility is only 16%, the average move is about $23.87, and the average result is about −$8.93 per share, or −$893 per contract.
Look again at step 3. Under the market's pricing, the buyer wins less than half the time, yet the trade is roughly fair on average, because winning outcomes are bigger than losing ones. A low probability of profit and a bad expected value are two separate claims.
These numbers assume normal returns, no drift, zero interest rates and no dividends. Real returns have fatter tails and skew, so use them for intuition, not as forecasts.
What the evidence says about buyers and sellers
If straddles were fairly priced on average, neither side would hold an edge. Index-option data suggests they are not.
Coval and Shumway (2001) analyzed S&P 500 index options from January 1990 to October 1995, using weekly returns on contracts about a month from expiration, along with S&P 100 options from 1986 to 1995. They formed at-the-money straddles weighted to have zero market beta. Those straddles lost roughly 3% per week on average, and similar positions in other markets lost money as well.
The authors read this as a price for volatility risk: buyers accept a steady loss, much like an insurance premium, because volatility tends to jump exactly when markets fall. This is the volatility risk premium.
Two caveats matter. The sample covers index options in the early 1990s, not single stocks and not today's market. And an average hides the path: the seller who earns that premium most weeks is writing the insurance, and the large losses cluster in crashes, often just as margin requirements rise.
What it means in practice
- Price the move, not the direction. Divide the straddle price by the stock price and set that next to your own estimate of the coming move. That comparison is the trade.
- Implied volatility at entry sets the hurdle. Higher IV means a wider breakeven zone. That raises the bar for buyers and widens the cushion for sellers. IV rank, today's IV relative to its range over the past year, is one way to judge whether the hurdle is high or low for that stock.
- IV changes can outweigh the move. Ahead of a scheduled event like earnings, IV is often elevated. If it drops sharply once the news is out, a long straddle can lose money even though the stock moved. The reverse hurts sellers: a jump in IV alone can show a loss before either breakeven is reached.
- Theta and gamma are one trade-off. The buyer pays daily time decay to own positive gamma; the seller earns that decay for carrying negative gamma. Both intensify near expiration, which is one reason many positions are closed weeks before it.
- Short straddles demand active risk management and capital. When the stock tests a breakeven, the usual choices are to move the untested leg closer to the current price, extend to a later expiration, or exit. Margin on a naked straddle is sized to a large adverse move and varies by account type.
What the straddle math doesn't tell you
The 0.8 · S · σ · √T shortcut assumes an at-the-money-forward option, zero rates and dividends, and normally distributed returns. Its accuracy fades away from the money, and it ignores skew, the tendency for puts to trade at higher implied volatility than calls.
Expiration diagrams also hide the path. Most straddles are closed early, and their value before expiration depends on IV changes and time decay as much as on the stock price.
Finally, the expected-profit formula describes an average across many trades. Any single straddle is a high-variance bet, especially on the short side. Commissions and bid-ask spreads on two legs also chip away at a premium that, on this math, starts out close to fair.
Where Quantropy fits
Whether straddles have paid buyers or sellers is an empirical question, and the answer shifts with the underlying, the IV regime at entry, days to expiration and the exit rule. In Quantropy you can describe a straddle rule in plain English, such as "sell the 30-day at-the-money SPY straddle when implied volatility is in the top third of its one-year range, and exit at half the credit or after 10 days," and test it on tick-level historical options data, including the crash periods that averages tend to blur. Join early access.
This post is for educational purposes only and does not constitute financial or investment advice. Options trading involves substantial risk of loss and is not suitable for all investors. Backtested results are hypothetical, have inherent limitations, and do not guarantee future performance.
Sources
- Brenner, M., & Subrahmanyam, M. G. (1988). "A Simple Formula to Compute the Implied Standard Deviation." Financial Analysts Journal, 44(5), 80–83.
- Coval, J. D., & Shumway, T. (2001). "Expected Option Returns." The Journal of Finance, 56(3), 983–1009. https://doi.org/10.1111/0022-1082.00352