
Every so often an options chain shows a trade that cannot lose. We ran into one while testing backtesting routines in thinkorswim: an iron condor whose natural price showed a $5.40 credit on $5.00-wide wings. Collect $5.40, risk at most $5.00, and you keep at least $0.40 whatever happens.
The platform rejected the order instantly. This post explains why that "arbitrage" appears on screen, why it never fills, and why the same illusion quietly inflates backtests that read fills straight off quote data.
Why a credit above the width is "free money"
An iron condor is two credit spreads sold together: a put spread below the market and a call spread above it. If both spreads are $5 wide, the worst case at expiration is that one side finishes fully in the money and costs you $5.00. Both sides can't lose at once, because the price can't be below the puts and above the calls at the same time.
Max loss = W − C
where:
- W is the width of each spread (here $5.00)
- C is the total credit collected for the condor
If C is larger than W, the max loss is negative. In plain terms: the worst outcome is still a profit. At $5.40 on a $5.00 condor, the floor is a $0.40 gain, or $40 per contract.
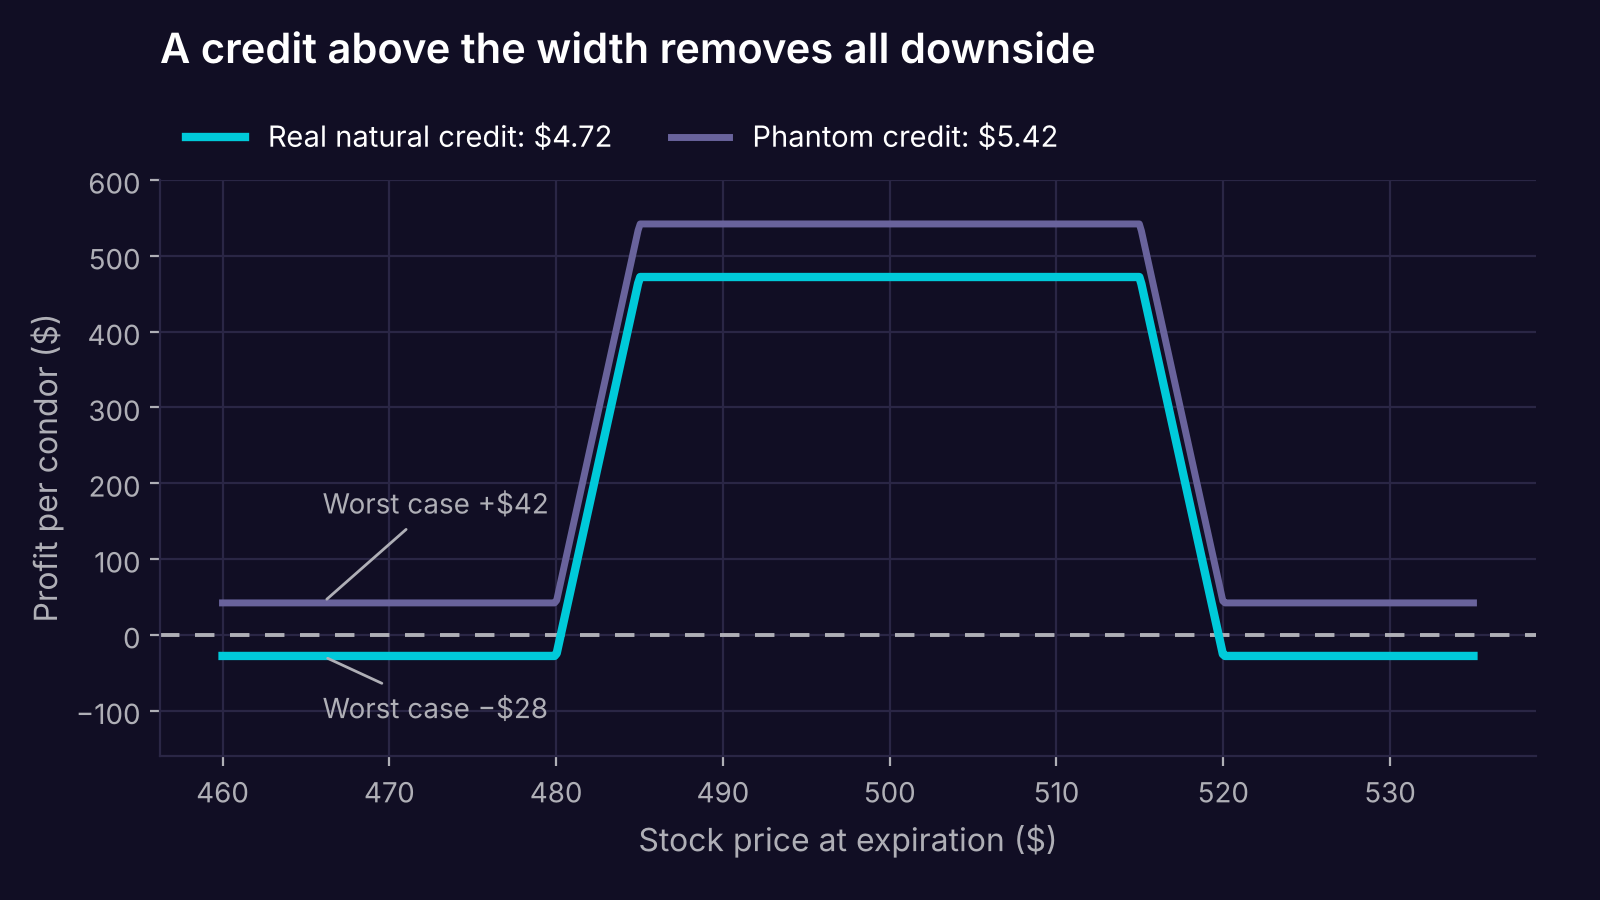 Payoff at expiration for the worked example below. At the real natural credit (teal) the condor can lose up to $28 per contract. At the phantom credit (lavender) the whole line sits above zero, which no counterparty would ever agree to. Illustrative numbers, not market data.
A riskless profit has to come from someone. Whoever bought that condor from you would be locking in a guaranteed loss. No market maker quotes that on purpose, so the price on your screen is telling you something about the data, not about the market.
Where the number on your screen comes from
The quote you see for each leg is the NBBO (National Best Bid and Offer): the highest bid and lowest ask across every exchange listing that option. It isn't one market's quote. It's stitched together.
In US options, that stitching is done by OPRA (the Options Price Reporting Authority), the securities information processor for listed options. As of early 2026, 17 options exchanges send their quotes and trades into OPRA, which merges them into a single consolidated feed.
Two facts about that feed matter here.
The consolidation itself is fast. OPRA reported a median processing latency under 18 microseconds in September 2025. After a February 2024 network upgrade, its 99th-percentile latency fell from 543.5 to 57.5 microseconds, according to Databento.
The quotes change far faster than any human or retail platform can follow. In an eight-month 2015 sample, Andersen et al. counted about 227 million quote updates a day across Apple's option classes, against about 78,000 trades. That's roughly 2,900 quotes for every trade.
In plain terms: the delay is not mainly inside OPRA. It's in the race. Market makers reprice in microseconds, and the quote that reaches your desktop has passed through a data vendor, your broker's systems, the internet and the app itself. Each hop adds delay, and by the time a person reads a price, the firms that set it may already have moved.
How a crossed quote produces phantom credit
A crossed market is a moment when the best bid for an option is higher than the best ask, usually because those two numbers come from different exchanges. If Exchange A's bid is $10.20 and Exchange B's ask is $9.70, the NBBO says you can buy at $9.70 and sell at $10.20 at the same instant.
Exchanges are supposed to prevent this. Under the Options Order Protection and Locked/Crossed Market Plan, approved by the SEC in 2009, each exchange must have rules requiring its members to reasonably avoid displaying locked or crossed markets. So when a crossed NBBO does show up, it almost always means one side is stale. Typically one exchange has updated and the other hasn't caught up yet, or the update hasn't reached your feed.
The natural price of a multi-leg order inherits this. To fill a credit spread immediately, you sell each short leg at its bid and buy each long leg at its ask. If any one of those four numbers is stale in your favor, the combined credit is overstated. One crossed leg is enough.
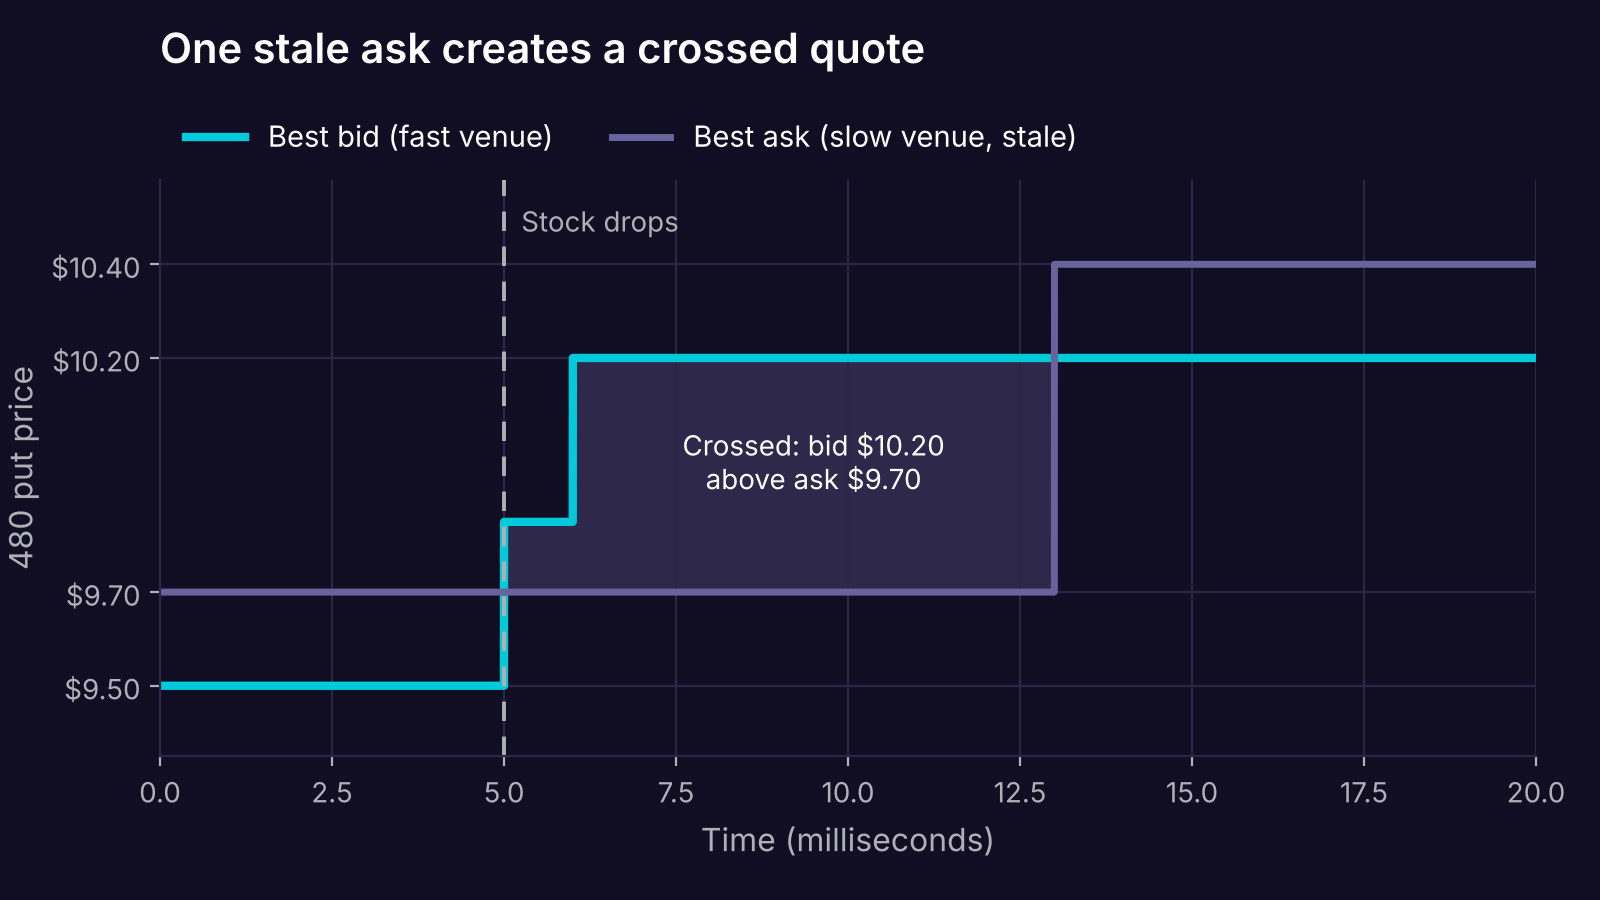 How a crossed quote forms, using the 480 put from the worked example below. Quotes move in discrete steps. When the stock drops, the fast venue raises its bid from $9.50 to $10.20 in two updates. The best ask stays at $9.70 because it comes from a venue that hasn't repriced yet. Until that venue updates to $10.40, the bid sits $0.50 above the ask, and any chain snapshot taken in that window shows phantom credit. Illustrative numbers and timing, not market data.
A worked example
Take a stock that has just fallen from $475 to $470. You look at a $480/$485 put spread and a $515/$520 call spread, both $5 wide. The put side is now deep in the money, so it alone is worth close to its full $5 width.
Here are the real, firm quotes a moment after the drop:
| Leg | Action | Bid | Ask | Natural price |
|---|---|---|---|---|
| 485 put | Sell | $15.10 | $15.30 | +$15.10 |
| 480 put | Buy | $10.20 | $10.40 | −$10.40 |
| 515 call | Sell | $0.07 | $0.09 | +$0.07 |
| 520 call | Buy | $0.03 | $0.05 | −$0.05 |
The natural credit is 15.10 − 10.40 + 0.07 − 0.05 = $4.72. That's below the $5.00 width, so the max loss is $0.28, or $28 per contract. Nothing unusual.
Now suppose one venue's ask on the 480 put still shows $9.70, left over from a few milliseconds earlier when the stock was higher. The NBBO for that put is now crossed: best bid $10.20, best ask $9.70. The natural credit becomes 15.10 − 9.70 + 0.07 − 0.05 = $5.42.
One stale number, $0.70 off, turned an ordinary trade into "free money." This is why phantom credits cluster in condors and spreads with one side deep in the money. When a spread already trades near its full width, a small quote error is enough to push the total over the line.
Why the order never fills
Two separate things stop it.
The broker rejects it first. Brokers validate spread prices before routing. thinkorswim's own list of rejection reasons includes "Invalid Price" for exactly this case: a spread credit may not exceed the width of the strikes. The order never reaches an exchange.
The exchange wouldn't fill it anyway. An iron condor goes to the exchange as one complex order: a single order for several legs with one net price. Cboe's complex order rules guarantee that if it fills, it fills at or better than your net price. It can trade against another complex order, or "leg in," meaning each leg executes against that leg's own best bid or offer, and Cboe allows legging for orders of up to four legs. Either way, every leg has to find real, firm liquidity at once. A stale $9.70 ask that disappeared milliseconds ago can't supply its leg.
In plain terms: the rejection is a broker safety check, not a market maker's risk system declining your trade. But even without the check, the price was never really there to take.
Why this distorts backtests
A backtest that fills orders at the NBBO in its data assumes every quote in the record was available to you at that moment. That assumption fails in two ways.
Stale and crossed quotes become fake fills. If your data includes the instant when the 480 put showed a $9.70 ask, a naive fill model books a $5.42 credit. In a live account, that order would have been rejected or missed. A strategy that enters on wide credits can look best in exactly the moments when its fills were least real.
Snapshot timing hides the race. Many datasets sample quotes once per minute or once per second. A snapshot that lands inside a crossed millisecond records a price that existed only for the fastest firms. Repeat that across thousands of entries and exits, and the bias adds up, always in the backtest's favor.
The reverse error also exists. Muravyev and Pearson (2020) found that options traders who time their executions pay effective spreads less than 40% of conventional estimates. So "always fill at the natural price" can overstate costs for patient traders, while "fill at whatever the quote said" can overstate what was ever reachable. Neither shortcut matches a real fill.
What it means in practice
- Treat a credit at or above the width as a data flag, not a signal. A static no-arbitrage bound was violated. The question is which quote is stale, not how to capture it.
- Filter crossed and locked quotes before computing fills. Andersen et al. recommend removing quotes with negative spreads as data errors when cleaning OPRA records. Check each leg's NBBO, not just the combined price.
- Check the bound on every multi-leg fill. If a simulated credit spread fills for more than its width, or a debit spread for less than zero, the backtest should reject it the way a broker would.
- Be most skeptical near expiration and deep in the money. Spreads priced close to their width have the least room for quote error.
What this doesn't tell you
The mechanism here is clear, but how often phantom credits show up in a given dataset isn't something this post measures. That depends on the underlying, the time of day, how volatile the session was and how the data vendor samples and cleans quotes.
The max-loss bound also assumes holding to expiration. Equity options are American-style, so a short leg can be assigned early. That doesn't remove the width bound, but it can add financing costs and operational risk that the simple formula ignores.
Finally, filtering crossed quotes doesn't make a fill model realistic on its own. Queue position, partial fills, size at the quote and price improvement all affect what a real order gets.
Where Quantropy fits
Quantropy runs backtests on tick-level historical options data, so fill logic can be checked against what each leg's quotes actually were at the moment of entry and exit. Spotting a phantom credit is one of the simpler checks. The harder part is making every fill in a backtest one you could have actually gotten. You can request access at quantropy.ai.
This post is for educational purposes only and does not constitute financial or investment advice. Options trading involves substantial risk of loss and is not suitable for all investors. Backtested results are hypothetical, have inherent limitations, and do not guarantee future performance.
Sources
- Andersen, T., Archakov, I., Grund, L., Hautsch, N., Nasekin, S., Nolte, I., Pham, M. C., Taylor, S., & Todorov, V. (2019). "A Descriptive Study of High-Frequency Trade and Quote Option Data." Working paper, Lancaster University / University of Vienna / Northwestern University. http://wp.lancs.ac.uk/fofi2020/files/2020/04/FoFI-2020-102-Manh-Cuong-Pham-.pdf
- Muravyev, D., & Pearson, N. D. (2020). "Options Trading Costs Are Lower than You Think." The Review of Financial Studies, 33(11), 4973–5014. https://econpapers.repec.org/RePEc:oup:rfinst:v:33:y:2020:i:11:p:4973-5014.
- U.S. Securities and Exchange Commission. (2009). "Order Approving the National Market System Plan Relating to Options Order Protection and Locked/Crossed Markets." Release No. 34-60405. https://www.sec.gov/file/release-no-34-60405
- Options Price Reporting Authority. (2025). "Revised OPRA Capacity Projections." Notice to OPRA Multicast Data Subscribers, September 15, 2025. https://cdn.opraplan.com/documents/notices/OPRA_Capacity_Projections_Update_0925.pdf
- Databento. "Options Price Reporting Authority (OPRA)." Databento Microstructure Guide. https://databento.com/microstructure/opra
- Exegy. "What Is Options Price Reporting Authority (OPRA)?" Exegy blog, March 2026. https://www.exegy.com/what-is-options-price-reporting-authority/
- Cboe Global Markets. "Cboe Titanium U.S. Options Complex Book Process." Technical specification. https://cdn.cboe.com/resources/techspec/technical-specifications-cboe-titanium-u-s-options-complex-book-process.pdf
- Charles Schwab. "Order Rejection Reasons." thinkorswim Learning Center. https://toslc.thinkorswim.com/center/howToTos/thinkManual/Trade/Order-Entry-Tools/Order-Rejection-Reasons